GATE 2015 CS (CS3) – Question 9
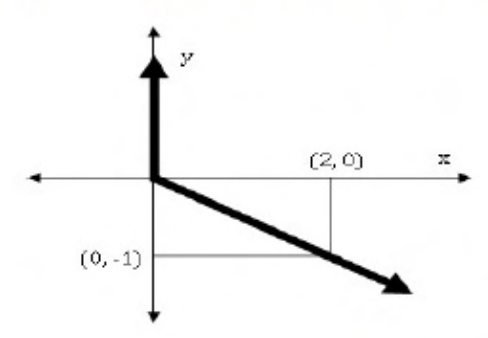
Which equation describes the thick line in the plotted graph?
Practise this question in The GATE Grind →
Show answer and explanation
Correct answer: (B) x=−(y−|y|)
Explanation
For y≥0 the graph lies on the positive y-axis, so x=0. For y<0 it runs through (2,−1), so x=−2y. The expression −(y−|y|) equals zero in the first case and −2y in the second. Thus B.
More Quantitative Aptitude: Algebra, Geometry and Mensuration questions
- GATE 2021 CS (CS2) Q3
- GATE 2021 CS (CS2) Q4
- GATE 2021 CS (CS2) Q8
- GATE 2025 CS (CS1) Q7
- GATE 2025 CS (CS2) Q3
- GATE 2025 CS (CS2) Q9
All Quantitative Aptitude: Algebra, Geometry and Mensuration questions →