GATE 2015 EE (EE2) – Question 35
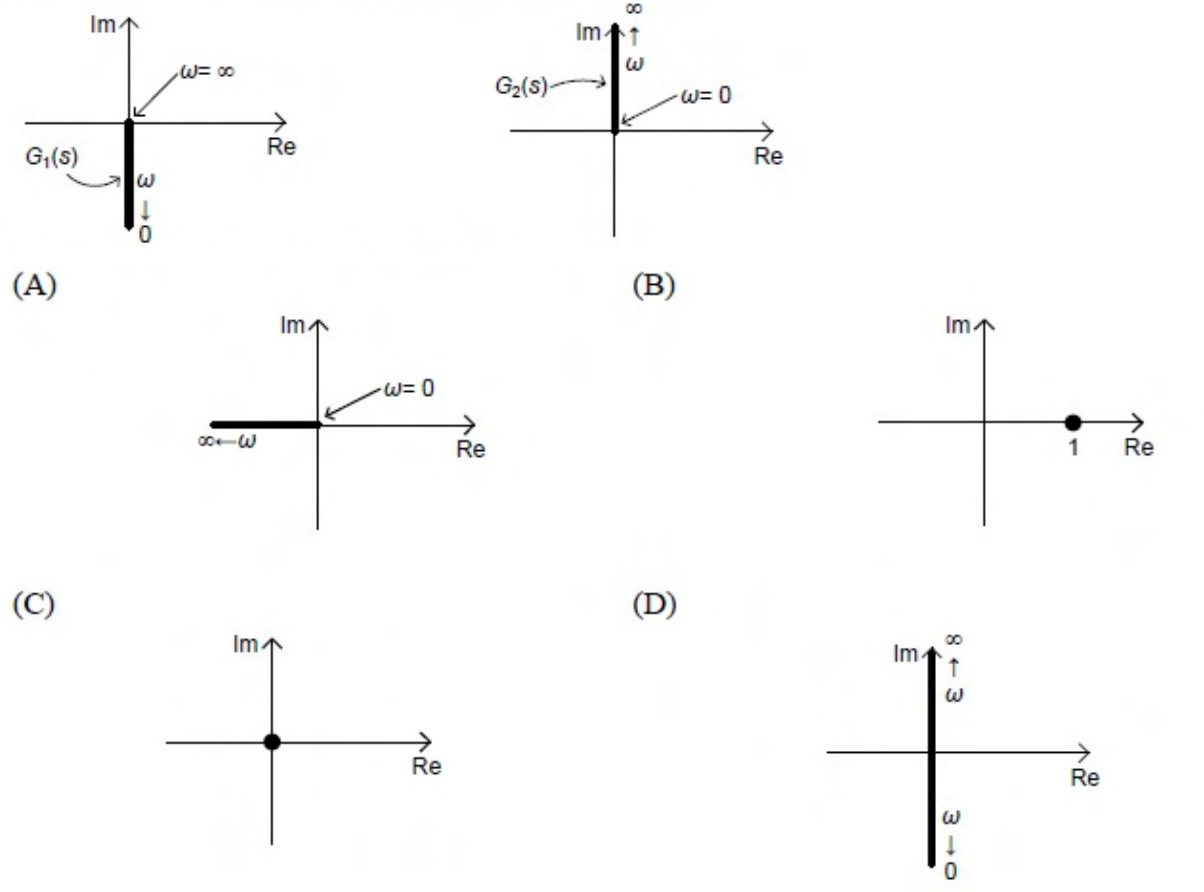
The figure shows Nyquist loci for G1 and G2. Which choice is the Nyquist plot of their product?
Practise this question in The GATE Grind →
Show answer and explanation
Correct answer: (B) Option B in the figure
Explanation
The intended normalized pair is an integrator and differentiator: G1(jω)=1/(jω) traces the negative imaginary axis from infinity to zero, while G2(jω)=jω traces the positive imaginary axis from zero to infinity.
Their product is identically 1, giving the point **+1 on the real axis, B**.
**Source qualification:** unscaled locus shapes alone do not specify magnitudes at matching frequencies. The exact unity point needs the intended reciprocal, unit-normalized pair; the displayed shapes by themselves cannot prove that normalization.
More Stability analysis using Routh-Hurwitz and Nyquist criteria, Bode plots, Root loci questions
- GATE 2015 EE (EE2) Q64
- GATE 2026 EE Q29
- GATE 2025 EE Q23
- GATE 2025 EE Q29
- GATE 2025 EE Q41
- GATE 2024 EE Q57
All Stability analysis using Routh-Hurwitz and Nyquist criteria, Bode plots, Root loci questions →