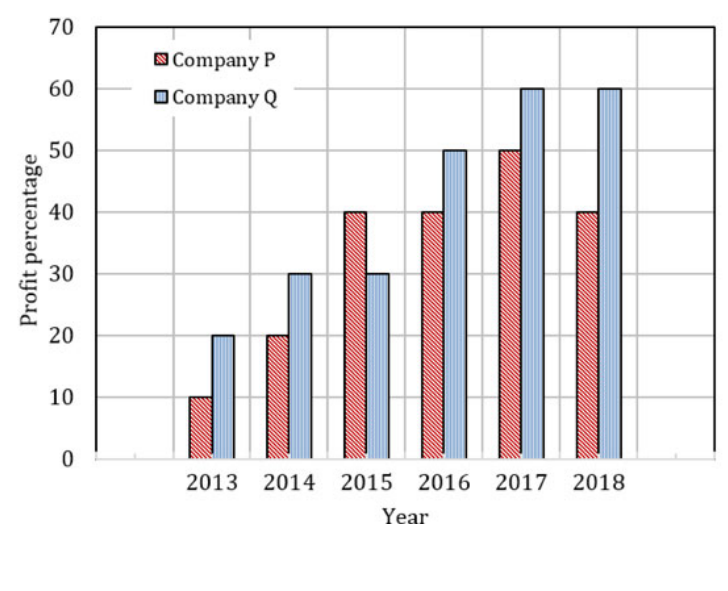
The chart shows profit percentages of companies P and Q during 2013–2018. Both invest a fixed, equal amount every year. Find the ratio of P’s total revenue to Q’s total revenue for these years.
Let each annual investment be C. The six P percentages sum to $10+20+40+40+50+40=200$, so P’s total revenue is $6C+2C=8C$. Q’s percentages sum to $20+30+30+50+60+60=250$, giving $6C+2.5C=8.5C$. Their ratio is $8:8.5=16:17$, B. Using profit alone would omit the annual investments.
More Quantitative Aptitude: Data Interpretation, Arithmetic and Number Computation questions
GATE 2020 CY Q5– A product moves through five successive supply-chain levels P → Q → R → S → T → Customers.…
GATE 2020 CY Q8– 52 men can complete a highway strip between cities P and Q in 10 days. An emergency…
GATE 2020 CY Q10– The pie charts show percentages of all university students and girls by stream. Total…
GATE 2020 MT Q10– The bar graph shows students who appeared and passed in an examination for schools P, Q, R…
GATE 2019 AE Q7– A country has population 1400 million, of whom 70% own mobile phones. Among phone owners,…
GATE 2019 AE Q9– Two trains leave the same point at 7 AM, one north at 80 km/h and the other south at 100…