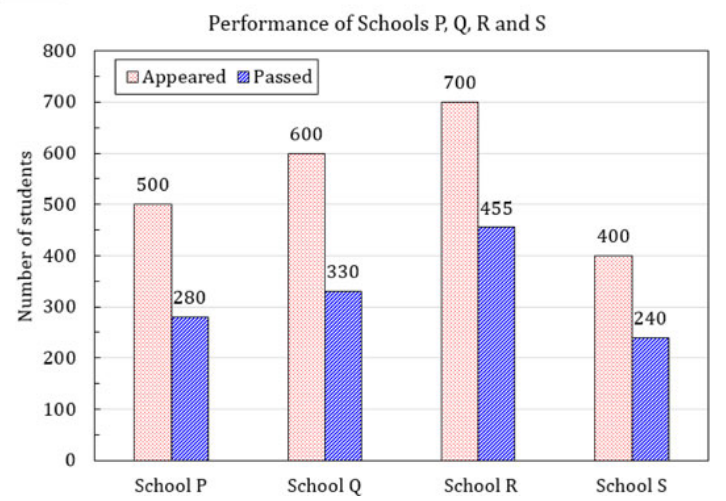
The bar graph shows students who appeared and passed in an examination for schools P, Q, R and S. Find the average success rate (percentage) of the four schools.
The four success rates are 280/500=56%, 330/600=55%, 455/700=65%, and 240/400=60%. Their arithmetic mean is (56+55+65+60)/4=**59.0%, C**. The requested mean of school percentages differs from the aggregate pass percentage.
More Quantitative Aptitude: Data Interpretation, Arithmetic and Number Computation questions
GATE 2019 AE Q7– A country has population 1400 million, of whom 70% own mobile phones. Among phone owners,…
GATE 2019 AE Q9– Two trains leave the same point at 7 AM, one north at 80 km/h and the other south at 100…
GATE 2019 BT Q7– A country has population 1400 million, of whom 70% own mobile phones. Among phone owners,…
GATE 2019 BT Q9– Two trains leave the same point at 7 AM, one north at 80 km/h and the other south at 100…
GATE 2019 CY Q3– A worker notices that the hour hand of the factory clock moved 225° during her stay. How…
GATE 2019 CY Q9– A firm had 600 employees in 2010, divided among skills P,Q,R,S,T as shown. Total…