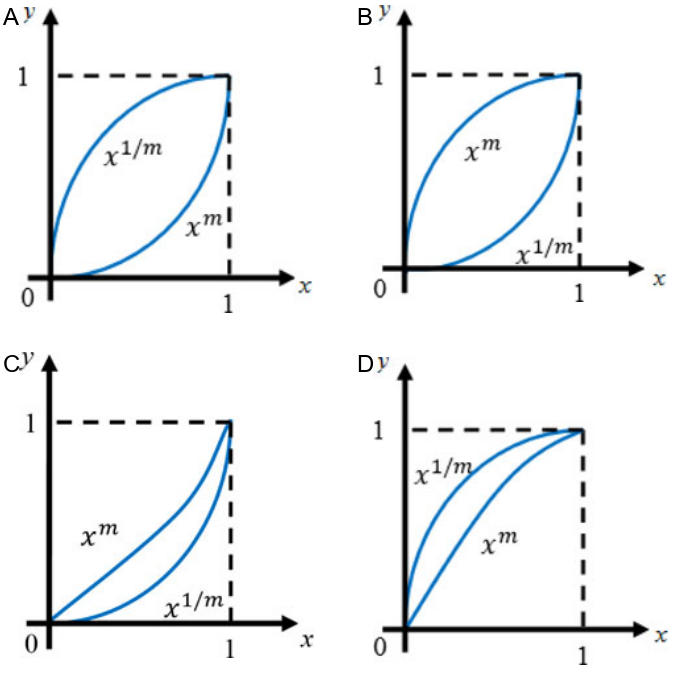
Select the graph that schematically represents BOTH $y=x^m$ and $y=x^{1/m}$ properly in $0\le x\le1$, for integral m > 1. The choices are arranged A, B in the top row and C, D in the bottom row.
For 0<x<1, increasing the exponent decreases the value, so $x^m<x<x^{1/m}$. The power m curve is convex and the reciprocal-power curve is concave. Both pass through (0,0),(1,1) and are reflections across y=x. Only **A** has the correct labels and shapes.
More Quantitative Aptitude: Algebra, Geometry and Mensuration questions
GATE 2019 AE Q3– The radius and height of a circular cone each increase by 10%. What is the percentage…
GATE 2019 BT Q3– The radius and height of a circular cone each increase by 10%. What is the percentage…
GATE 2019 CY Q4– Two integers have sum 26 and product 165. What is their positive difference?
GATE 2019 CY Q7– ₹100000 is split between schemes yielding 10% and 12%. Interchanging the two rates would…
GATE 2019 MT Q3– The radius and height of a circular cone each increase by 10%. What is the percentage…
GATE 2020 AG Q5– A superadditive function satisfies f(x 1+x 2) f(x 1)+f(x 2). Which function has this…