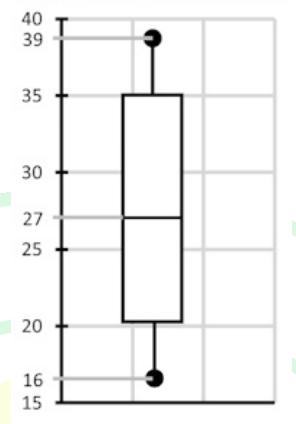
The bottom and top edges of the box give Q₁=20 and Q₃=35. Therefore IQR=Q₃−Q₁=15. The median27 and the whisker endpoints16,39 do not define the interquartile range.
More Probability and Statistics questions
GATE 2025 MN Q52– Five Fe-grade observations are62,64,63,60,61 percent. Estimate the standard error of their…
GATE 2024 MN Q45– Mines M 1, M 2, M 3 supply 60%, 25%, 15% of coal. Their probabilities of below-Grade 1…
GATE 2023 MN Q16– For random variables X and Y, what is E(3X−5Y)?
GATE 2023 MN Q42– An ordinary least-squares line for 50 observations of shovel production versus swing angle…
GATE 2022 MN Q37– Match plots P–S to attributes I: x> y, 0<<1; II: y> x, =1; III: y> x, 0<<1; IV: x= y, =1.…
GATE 2022 MN Q44– Daily probability of full COVID-bed occupancy at a health centre is 0.8. Under the…