GATE 2019 EC – Question 18
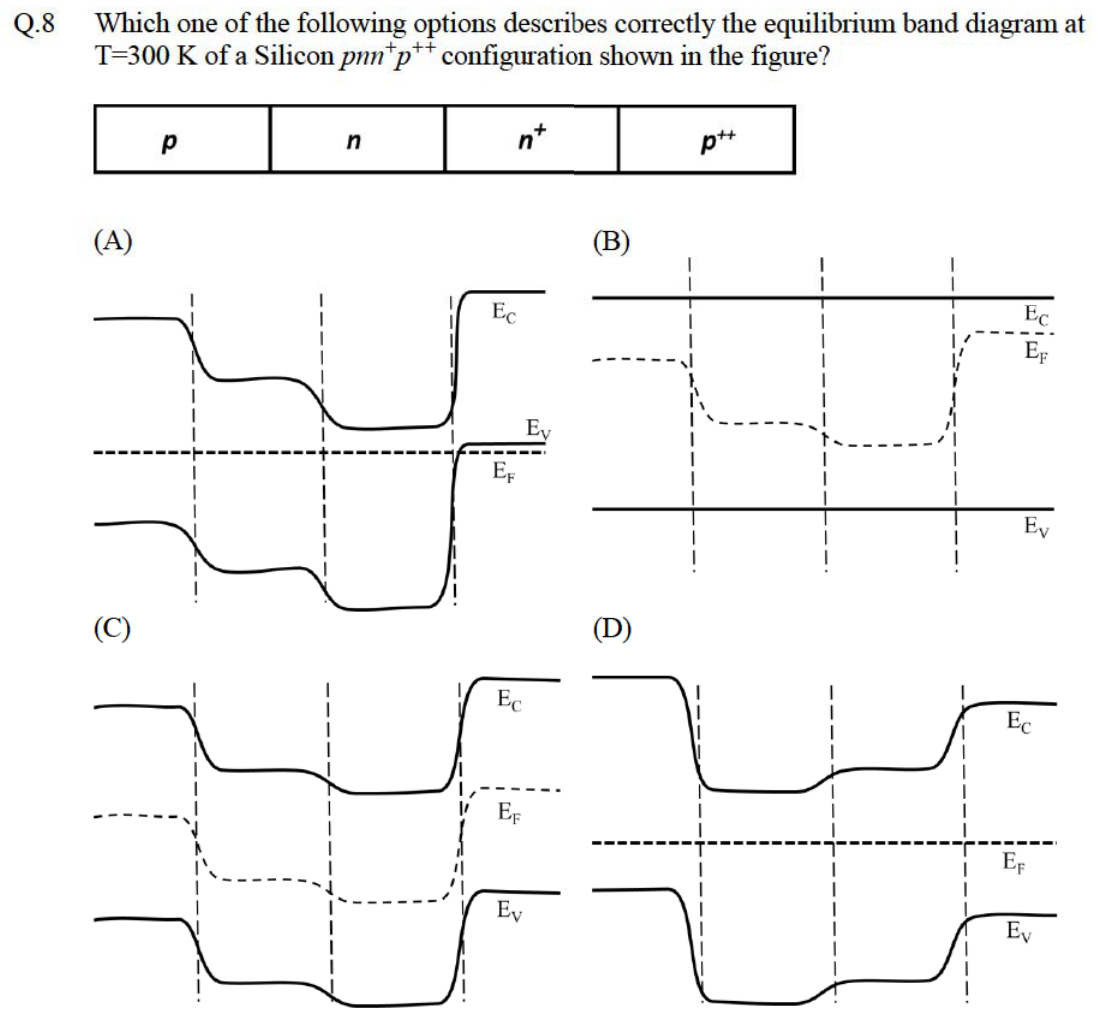
Which one of the following options describes correctly the equilibrium band diagram at T=300 K of a Silicon $pnn^+p^{++}$ configuration shown in the figure?
Practise this question in The GATE Grind →
Show answer and explanation
Correct answer: (A) Band diagram (A)
Explanation
In equilibrium the Fermi level is flat across the structure. Moving from $p$ to $n$, $n^+$ and $p^{++}$, the conduction band edge is closest to $E_F$ in the $n^+$ region and $E_F$ drops into the valence band in the heavily doped $p^{++}$ region, with a step at each junction. Diagram (A) is the one with a flat $E_F$ and these relative positions.