GATE 2025 EC – Question 56
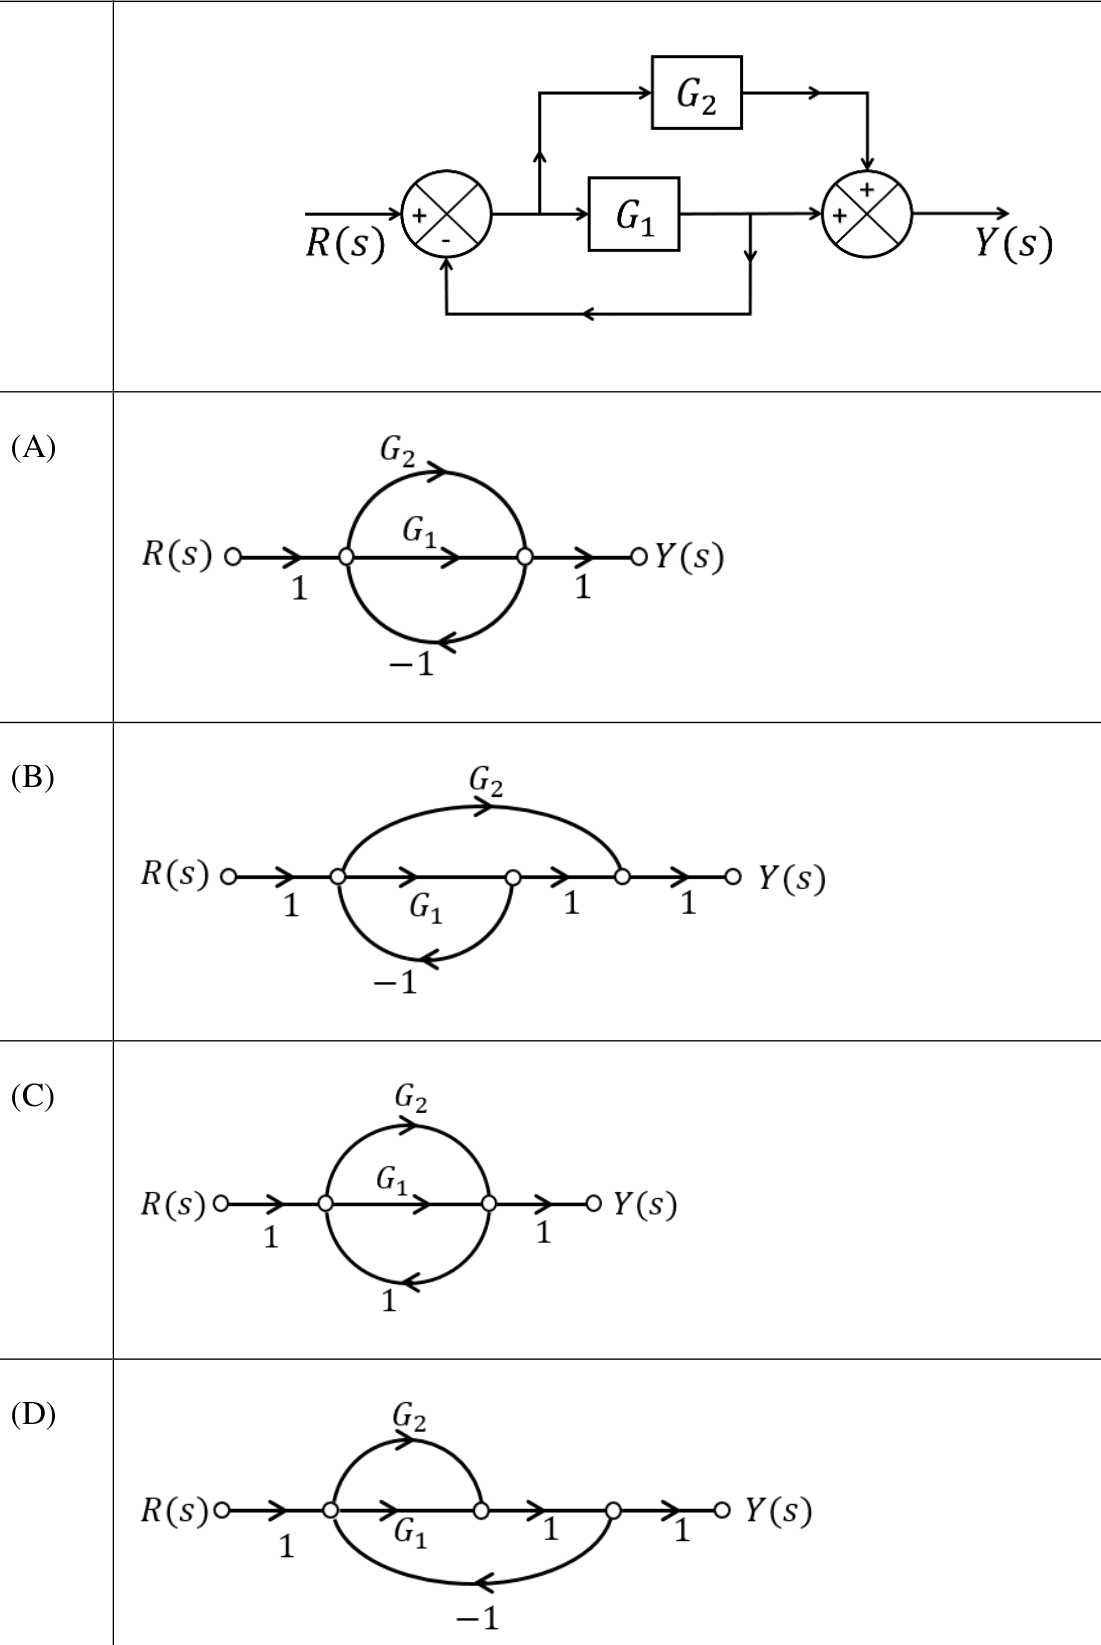
Consider a system represented by the block diagram shown below. Which of the following signal flow graphs represent(s) this system? Choose the correct option(s).
Practise this question in The GATE Grind →
Show answer and explanation
Correct answer: (B) Signal flow graph (B)
Explanation
Let $e=R-y_1$ be the first summer output. Then $y_1=G_1e$ (the signal after $G_1$, which is also fed back), and the output summer gives $Y=y_1+G_2e$. As a signal flow graph: $R\to e$ (gain 1), $e\to y_1$ (gain $G_1$), $y_1\to e$ (gain $-1$), $e\to Y$-node (gain $G_2$), $y_1\to Y$-node (gain 1), $Y$-node $\to Y$ (gain 1). This is graph (B): the $-1$ feedback comes from the node after $G_1$ and $G_2$ bypasses it. In (A) and (C) the feedback comes from the summed output; in (D) it comes from after the summing node.