GATE 2024 EC – Question 8
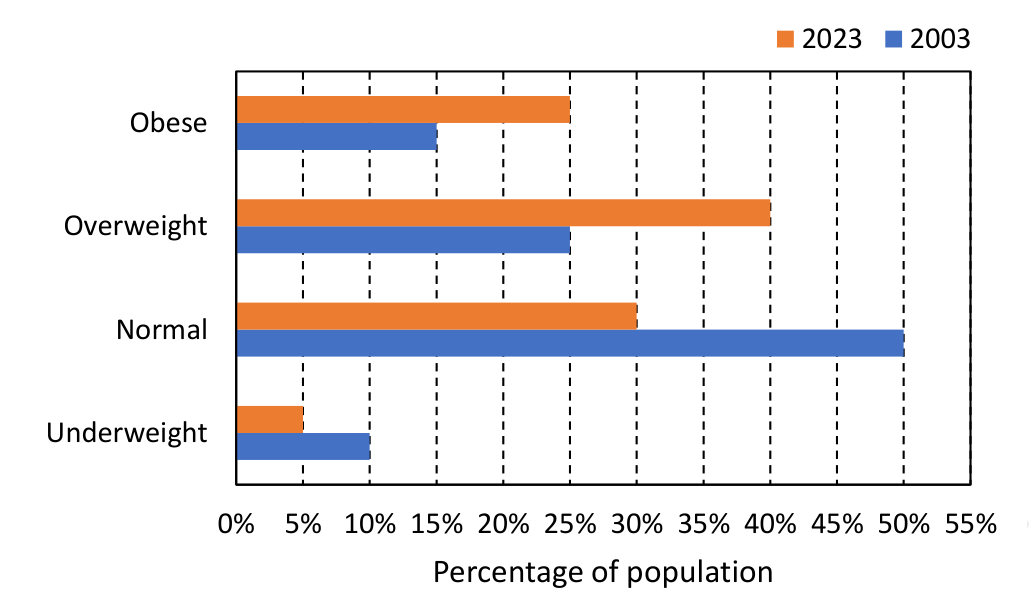
The bar chart shows the data for the percentage of population falling into different categories based on Body Mass Index (BMI) in 2003 and 2023.
Based on the data provided, which one of the following options is INCORRECT?
Practise this question in The GATE Grind →
Show answer and explanation
Correct answer: (C) The ratio of the percentage of population falling into obese category to the percentage of population falling into normal category has decreased in 20 years.
Explanation
Reading the chart (2003 → 2023): obese about 15% → 25%, overweight 25% → 40%, normal 50% → 30%, underweight 10% → 5%. (A) overweight/normal rose from 0.5 to about 1.33: correct. (B) underweight/normal fell from 0.2 to about 0.17: correct. (C) obese/normal rose from 0.3 to about 0.83, so "decreased" is incorrect. (D) normal fell from 50% to 30%: correct.