GATE 2025 EE – Question 25
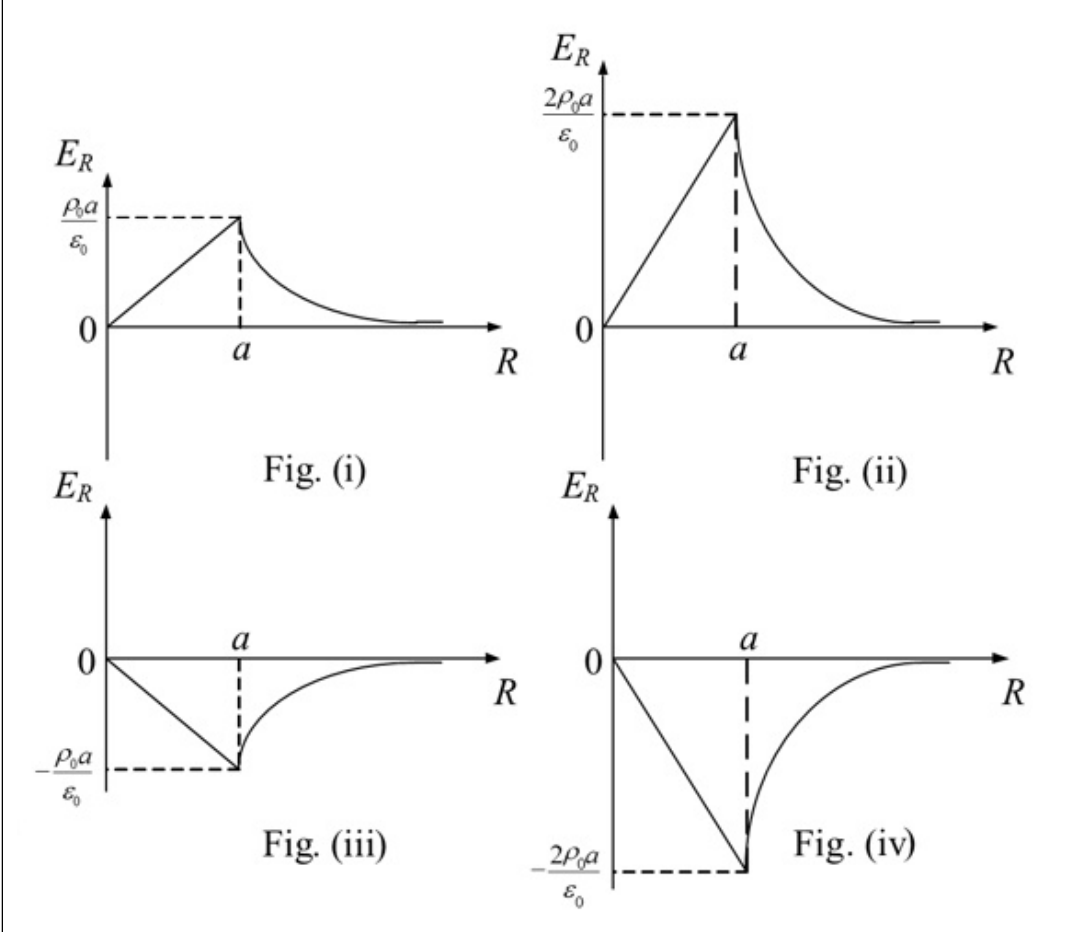
Which one of the following figures represents the radial electric field distribution $E_R$ caused by a spherical cloud of electrons with a volume charge density, $\rho=-3\rho_0$ for $0\le R\le a$ (both $\rho_0$, $a$ are positive and $R$ is the radial distance) and $\rho=0$ for $R>a$ ?
Practise this question in The GATE Grind →
Show answer and explanation
Correct answer: (C) Fig. (iii)
Explanation
By Gauss's law, inside the sphere $E_R=\dfrac{\rho R}{3\epsilon_0}=-\dfrac{\rho_0R}{\epsilon_0}$: negative and linear in $R$, reaching $-\dfrac{\rho_0a}{\epsilon_0}$ at $R=a$. Outside, the enclosed charge is $-4\pi\rho_0a^3$, so $E_R=-\dfrac{\rho_0a^3}{\epsilon_0R^2}$, which decays as $1/R^2$ from the same value at $R=a$. That is the negative, linear-then-decaying curve of Fig. (iii).