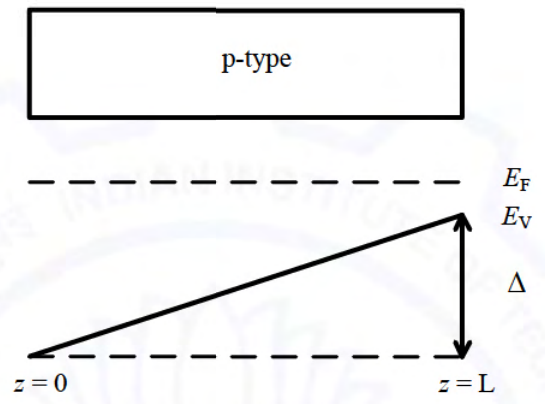
The energy band diagram of a p-type semiconductor bar of length $L$ under equilibrium condition (i.e., the Fermi energy level $E_F$ is constant) is shown in the figure. The valance band $E_V$ is sloped since doping is non-uniform along the bar. The difference between the valance band at the two edges of the bar is $\Delta$.
If the charge of an electron is $q$, then the magnitude of the electric field developed inside this semiconductor bar is
In equilibrium the Fermi level is flat, and the electric field $E=-\dfrac{dV}{dx}$ where $V$ is the electrostatic potential. The band edge is $E_V(x)=\text{constant}-qV(x)$, so $E=\dfrac1q\dfrac{dE_V}{dx}$.
The valence band edge is a straight line that changes by $\Delta$ over length $L$, so $\dfrac{dE_V}{dx}=\dfrac\Delta L$ and $|E|=\dfrac\Delta{qL}$.
More Energy Bands and Carrier Concentration questions
GATE 2020 EC Q16– A single crystal intrinsic semiconductor is at a temperature of 300 K with effective…
GATE 2019 EC Q18– Which one of the following options describes correctly the equilibrium band diagram at…
GATE 2018 EC Q55– A junction is made between p- Si with doping density N A1=1015\ cm-3 and p Si with doping…
GATE 2016 EC Q21– A small percentage of impurity is added to an intrinsic semiconductor at 300 K. Which one…
GATE 2017 EC Q19– A bar of Gallium Arsenide (GaAs) is doped with Silicon such that the Silicon atoms occupy…
GATE 2014 EC (EC1) Q45– A silicon diode has p-side doping 1016 cm⁻³ and n-side doping 1017 cm⁻³. Forward bias is…