GATE 2020 AG – Question 10
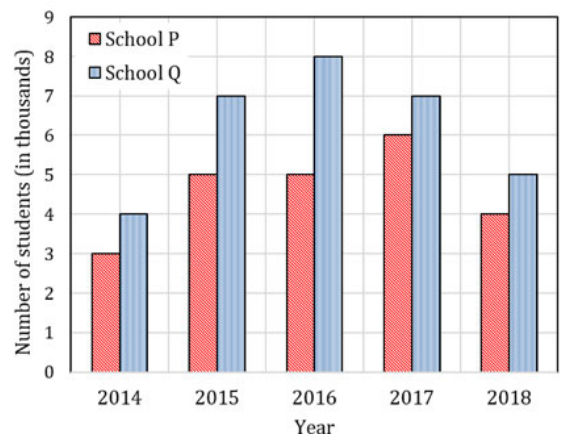
The graph shows school enrolments for 2014–2018. Find the ratio of average enrolment in P to the average difference between Q and P.
Practise this question in The GATE Grind →
Show answer and explanation
Correct answer: (B) 23:8
Explanation
Read P as 3,5,5,6,4 thousand, totalling 23; Q is 4,7,8,7,5 thousand, totalling 31. The difference total is 8. Division by five cancels in the ratio of means, leaving 23:8, B.
More Quantitative Aptitude: Data Interpretation, Arithmetic and Number Computation questions
All Quantitative Aptitude: Data Interpretation, Arithmetic and Number Computation questions →