The GATE Grind

GATE 2024 CE (CE2) – Question 8

General Aptitude · Analytical Aptitude: Logical Reasoning and Deduction · 2 marks · Multiple choice

The plot below shows the relationship between the mortality risk of cardiovascular disease and the number of steps a person walks per day. Based on the data, which one of the following options is true?
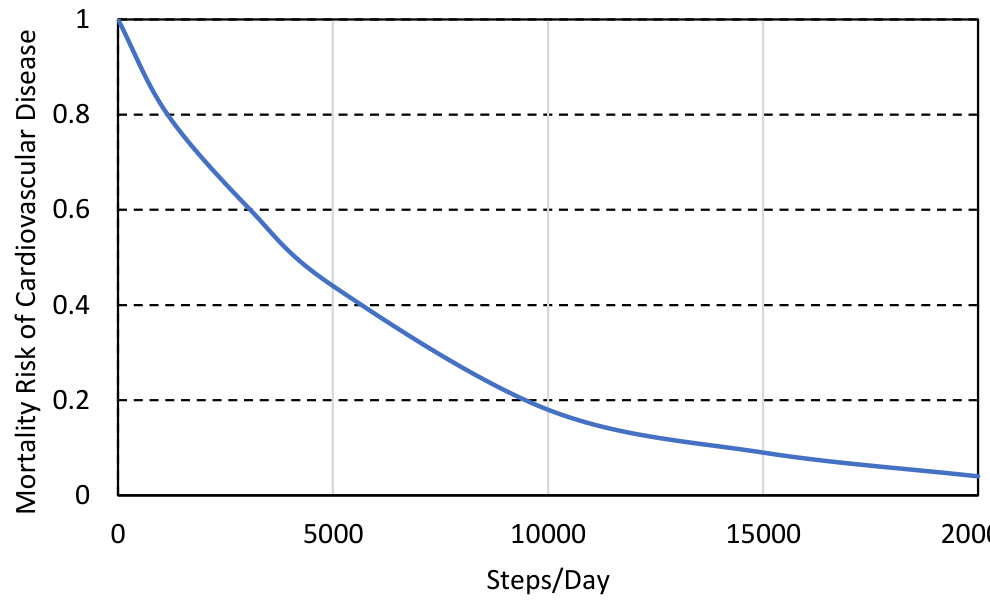
a curve of the mortality risk falling from 1 at 0 steps through about 0.45 at 5000, 0.18 at 10000 and 0.09 at 15000 to about 0.04 at 20000 steps per day.
  1. The risk reduction on increasing the steps/day from 0 to 10000 is less than the risk reduction on increasing the steps/day from 10000 to 20000.
  2. The risk reduction on increasing the steps/day from 0 to 5000 is less than the risk reduction on increasing the steps/day from 15000 to 20000.
  3. For any 5000 increment in steps/day the largest risk reduction occurs on going from 0 to 5000.
  4. For any 5000 increment in steps/day the largest risk reduction occurs on going from 15000 to 20000.

Practise this question in The GATE Grind →

Show answer and explanation

Correct answer: (C) For any 5000 increment in steps/day the largest risk reduction occurs on going from 0 to 5000.

Explanation

The curve is steepest at the start and flattens out. The drops over each block of 5000 steps are about 0.55 (0 to 5000), 0.27 (5000 to 10000), 0.09 (10000 to 15000) and 0.05 (15000 to 20000). So the largest reduction is for 0 to 5000, which is C. A and B compare the large early drop with the small later one the wrong way round.