GATE 2016 EC (EC2) – Question 6
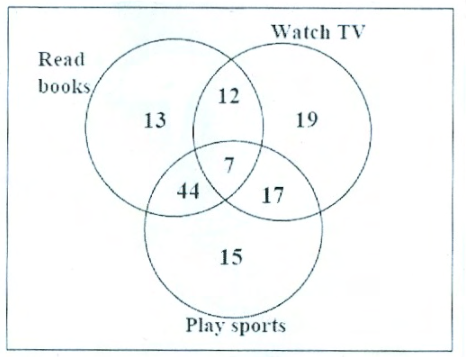
The Venn diagram gives student preferences for reading books, watching TV and playing sports. The number who like reading books or playing sports is ________.
Practise this question in The GATE Grind →
Show answer and explanation
Correct answer: (D) 108
Explanation
“Books or sports” denotes the union, including students who also watch TV. Sum the six regions belonging to either circle: $13+12+44+7+17+15=108$.
Only the TV-only region 19 is excluded. Equivalently, the total shown is 127 and 127−19=108. Thus **D**.
More Quantitative Aptitude: Data Interpretation, Arithmetic and Number Computation questions
- GATE 2016 EC (EC2) Q8
- GATE 2016 EC (EC2) Q9
- GATE 2016 EC (EC2) Q10
- GATE 2016 EC (EC3) Q4
- GATE 2016 EC (EC3) Q5
- GATE 2016 EC (EC3) Q6
All Quantitative Aptitude: Data Interpretation, Arithmetic and Number Computation questions →