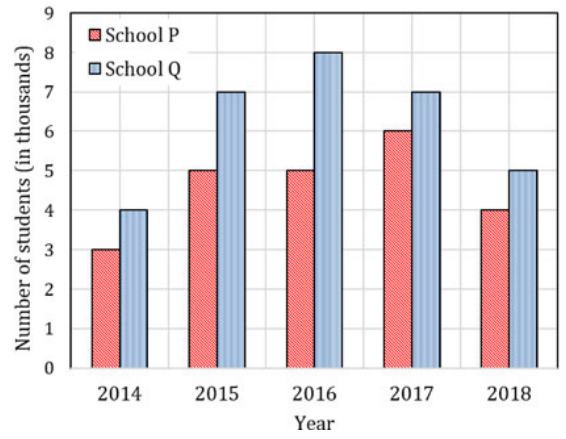
The figure shows school P and Q enrolments during 2014–2018. Find the ratio of average enrolment in P to the average difference in enrolment between the two schools over these years.
P enrolments in thousands are 3,5,5,6,4, summing to 23. Q values 4,7,8,7,5 sum to 31. The total positive difference Q−P is 8. Dividing both sums by five leaves ratio $23:8$, B. The common “thousands” scale cancels.
More Quantitative Aptitude: Data Interpretation, Arithmetic and Number Computation questions
GATE 2020 BT Q8– Delhi and Agra are 233 km apart. P travels from Delhi to Agra; Q starts from Agra to Delhi…
GATE 2020 BT Q10– The chart shows profit percentages of companies P and Q during 2013–2018. Both invest a…
GATE 2020 CY Q5– A product moves through five successive supply-chain levels P → Q → R → S → T → Customers.…
GATE 2020 CY Q8– 52 men can complete a highway strip between cities P and Q in 10 days. An emergency…
GATE 2020 CY Q10– The pie charts show percentages of all university students and girls by stream. Total…
GATE 2020 MT Q10– The bar graph shows students who appeared and passed in an examination for schools P, Q, R…