Quality and Reliability · Quality Management · 2 marks · Multiple select
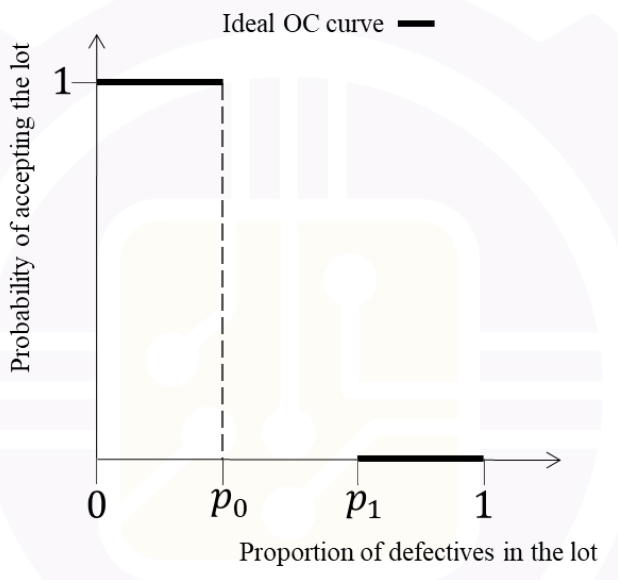
For the ideal OC curve shown, p₀ is acceptable quality level (AQL) and p₁ is lot tolerance percent defective (LTPD). Which ONE OR MORE statements are true?
Correct answer: (C) Producer’s risk is zero.; (D) Consumer’s risk is zero.
Explanation
Producer’s risk is $\alpha=1-P_a(p_0)$; the ideal curve accepts acceptable lots with probability one, giving α = 0. Consumer’s risk is $\beta=P_a(p_1)$; the curve rejects bad lots with probability one, giving β = 0. **C,D**.
More Quality Management questions
GATE 2025 PI Q34– Fifteen gearbox features are critical to quality. Of 40000 gearboxes produced last…
GATE 2025 PI Q62– A broach produces key slots of mean size 10.56 mm and standard deviation 0.05 mm. For…
GATE 2024 PI Q44– For an acceptance-sampling plan, which ONE OR MORE statements are true?
GATE 2023 PI Q33– Thirty samples of size 100 contain 420 total nonconformities. Find the lower control limit…
GATE 2022 PI Q19– Which control chart tracks the number of defects in a welded joint?
GATE 2022 PI Q43– Four products P,Q,R,S each have batch size 2 × 10⁷. Defective counts are 60,71,80,55…